participative and data-driven foresight

The interactive radar provides a dynamic visualization of relevant trends and developments within your key areas of interest. Users can apply various filters to sort trends based on specific criteria, uncovering potential correlations. This visual tool helps to focus on critical issues that impact individual areas of responsibility and provides an intuitive summary of the distribution and significance of pertinent topics.

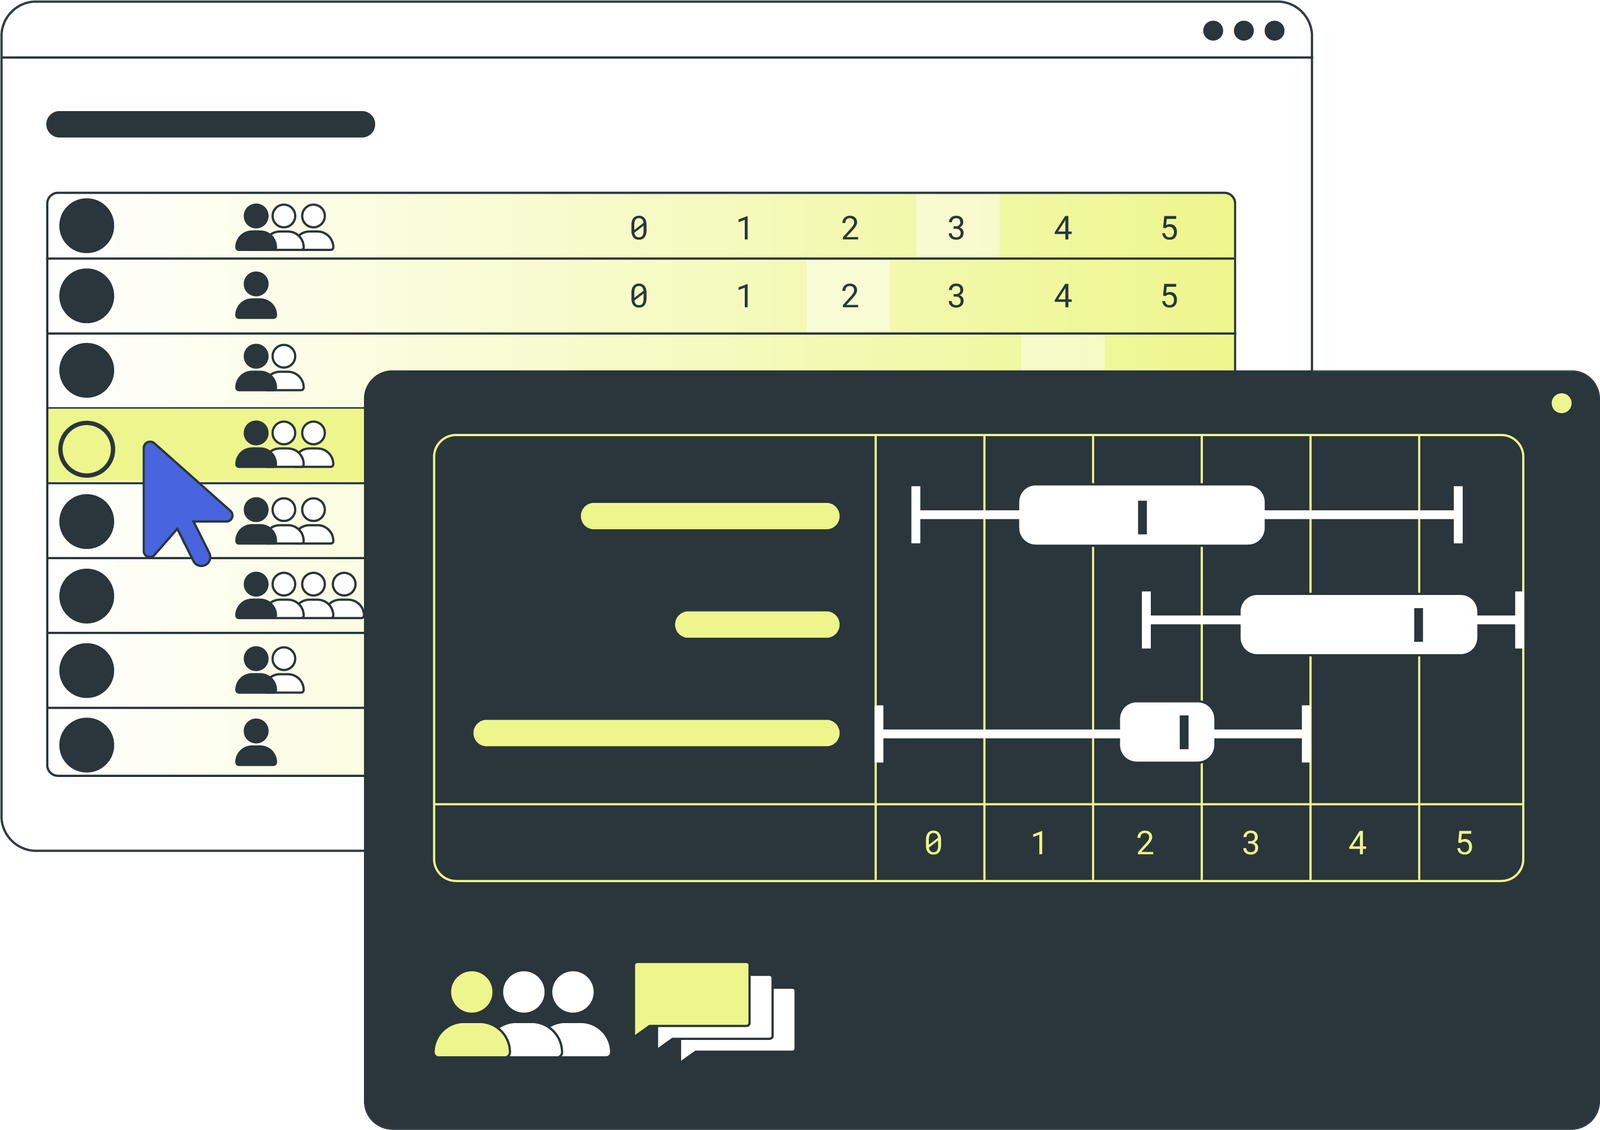
Identified trends and issues can be evaluated by various stakeholder groups using configurable criteria. This provides an overview of how themes and their effects are perceived from different perspectives. Interfaces that visualize evaluation results display the variance and spread of expert opinions within your organization, offering valuable insights into the collective and diverse viewpoints.

The foresight process engages different groups of participants: some design and manage the process, some contribute their insights, some make decisions, and others evaluate with an external perspective. Accordingly, they are shown appropriate levels of detail and are assigned corresponding authorizations. This ensures that experts access a broad base of information, while decision-makers with a high workload gain a quick overview. These authorizations can be configured as needed at any time, ensuring flexibility and relevance.

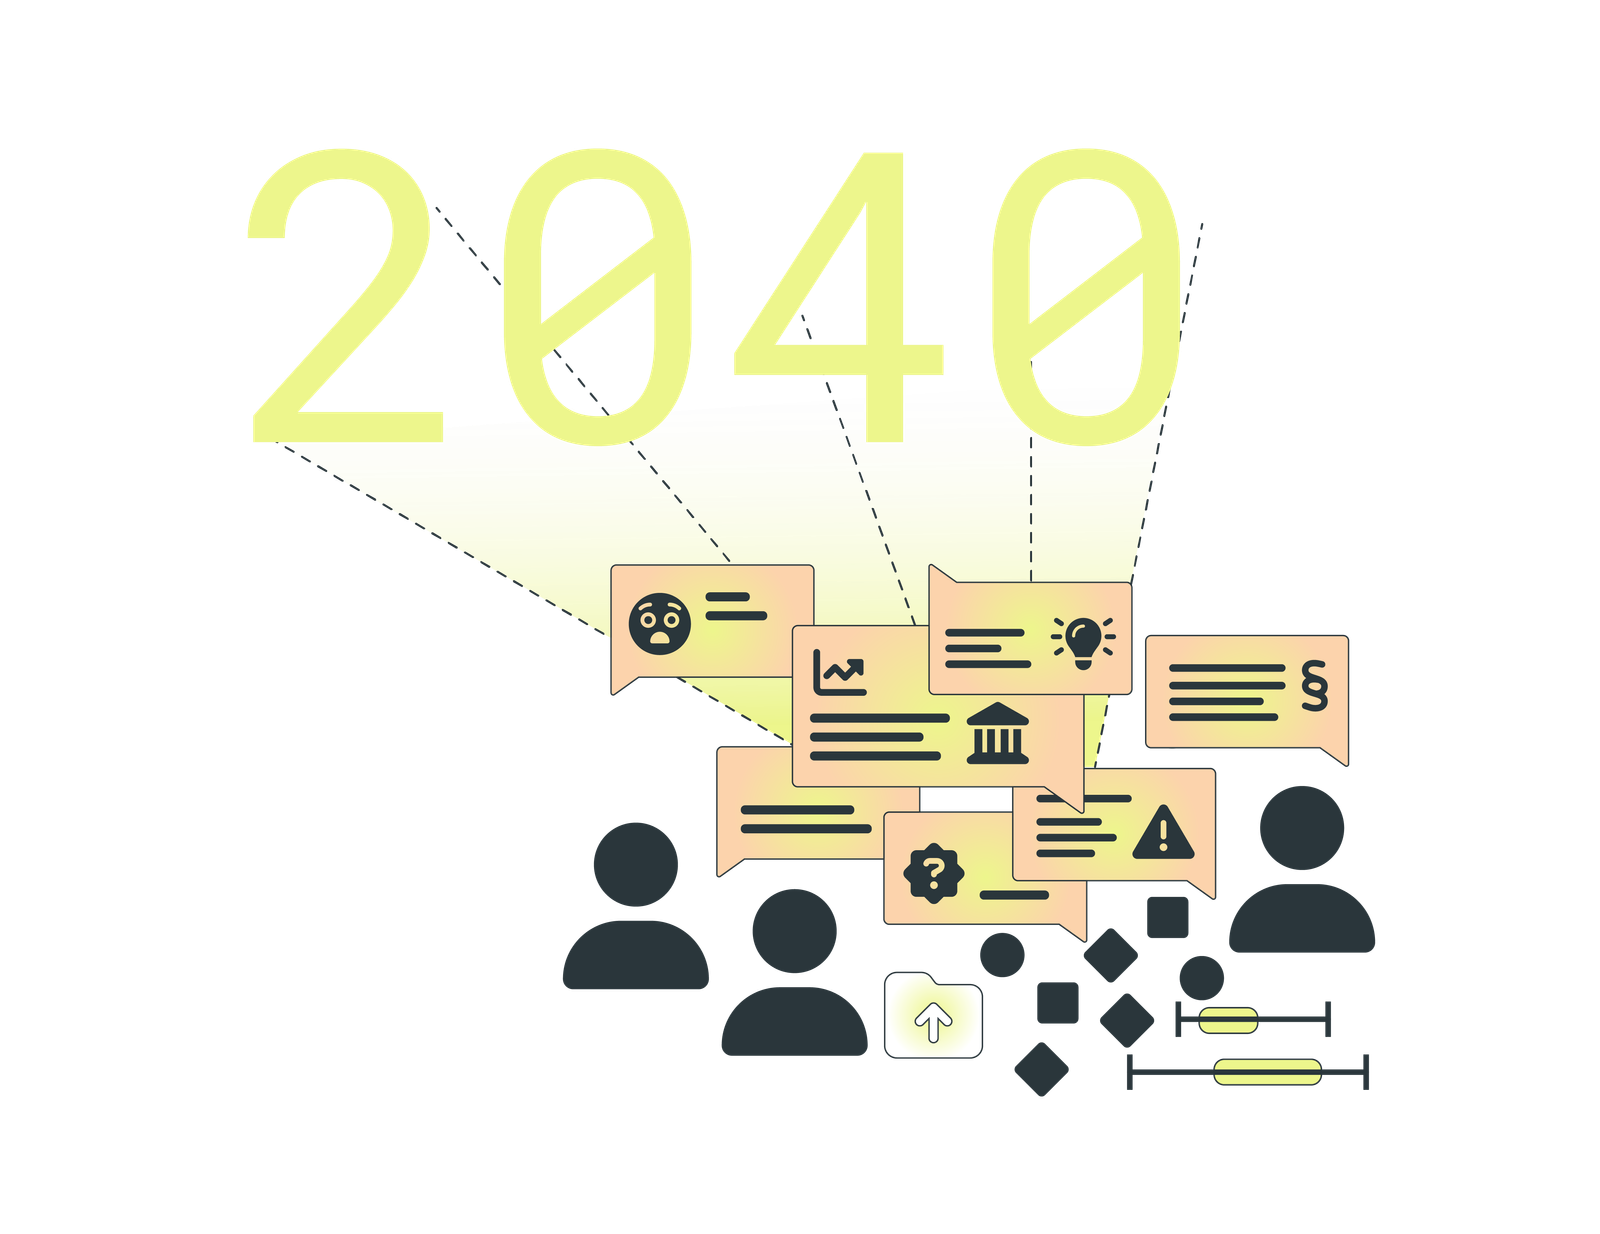
The foresight process addresses various types of topics, including trends, weak signals, blind spots, and legal issues. Depending on the topic type, different parameters for data collection can be defined. These topics progress through various statuses during the foresight process, such as draft, evaluation, and publication. You can determine the required level of detail for each topic and specify which information is displayed to each user group. This approach optimizes workload and ensures an efficient process.

flexibility and adaptability
The platform enables detailed role assignment, allowing different users to have specific permissions and access. This ensures that each employee only sees the relevant information and functions, increasing efficiency and security.
With PEACOQ, you can create and manage custom status values. This makes tracking and monitoring the progress of projects and tasks easier by using clear and relevant status indicators.
PEACOQ offers various display formats for data and information. You can use tables, charts, maps, and other visualizations to make your data understandable and insightful. This versatility supports better data analysis and decision-making.
The platform allows for the visual representation of results to quickly identify trends, patterns, and insights. With customizable dashboards and visualization widgets, you can capture the most important information at a glance.
PEACOQ’s modular architecture allows you to add or adjust features and modules as needed. You can extend the platform to meet new requirements without disrupting existing systems. This flexibility supports the continuous evolution of your innovation and foresight proces
PEACOQ offers extensive opportunities for integrating artificial intelligence. AI features can be used to automate tasks, support decision-making processes, and provide valuable insights. These functions can be further developed and customized in close collaboration with our customers to meet specific needs.
Explore Powerful Features